AND THE THIRD MOST EXPENSIVE HOUSING MARKET IN THE WORLD IS…
…Australia!
That’s right. Australia recently got the distinction as the 3rd most expensive major housing in the world. This comes after Demographia International Housing Affordability released its survey based on median house prices, median household income, and the resulting Median Multiple.
The survey analysed two groups of housing markets in 9 countries: the major housing markets, which is mainly focused on cities and mega-cities, and all housing markets which includes smaller housing markets outside of major cities.
Nine countries are included in the survey namely, the United States, United Kingdom, Singapore, New Zealand, Japan, Ireland, Hong Kong, Canada, and Australia. Out of the 406 all housing markets, 92 are major housing markets or markets with over 1,000,000 in population.
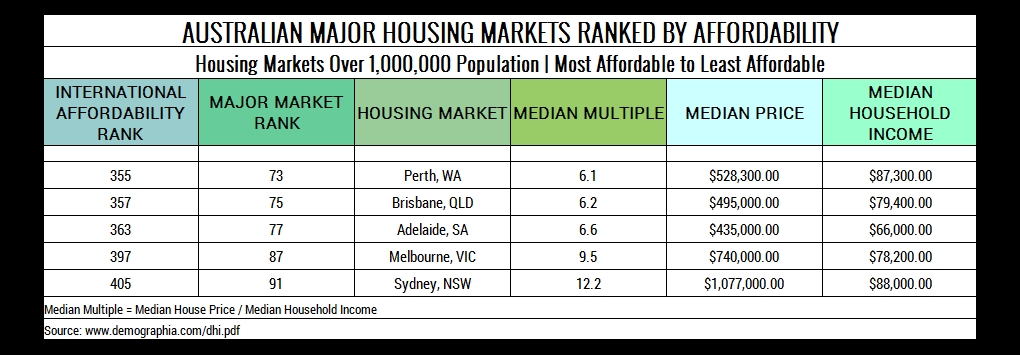
For Australia, the 5 major housing markets are Sydney, Melbourne, Adelaide, Brisbane, and Perth.
Let’s go through the survey findings.
IDENTIFYING HOUSING AFFORDABILITY
By taking into consideration the median house prices and dividing it by median household income reported from various data sources in Q3 of 2016, Demographia obtained the Median Multiple for each housing market included in the study. The resulting Median Multiple for each market is used in two ways:
- To identify the international ranking, national ranking, the major market ranking, and the all market ranking (major markets plus smaller markets within each country) of each housing market.
- To identify the housing affordability rating for each housing market.
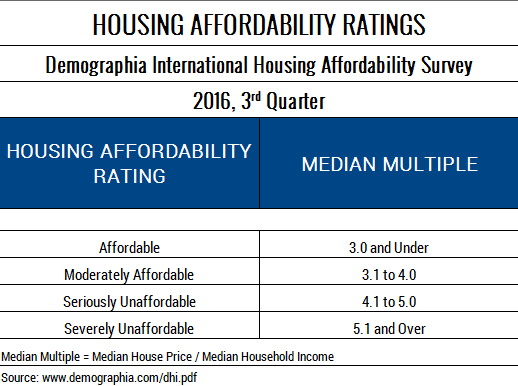
Note thought that the survey focused on rating middle-income housing affordability. The scale, in tabular form, is as follows:
A LOOK AT THE WORLD’S HOUSING MARKETS
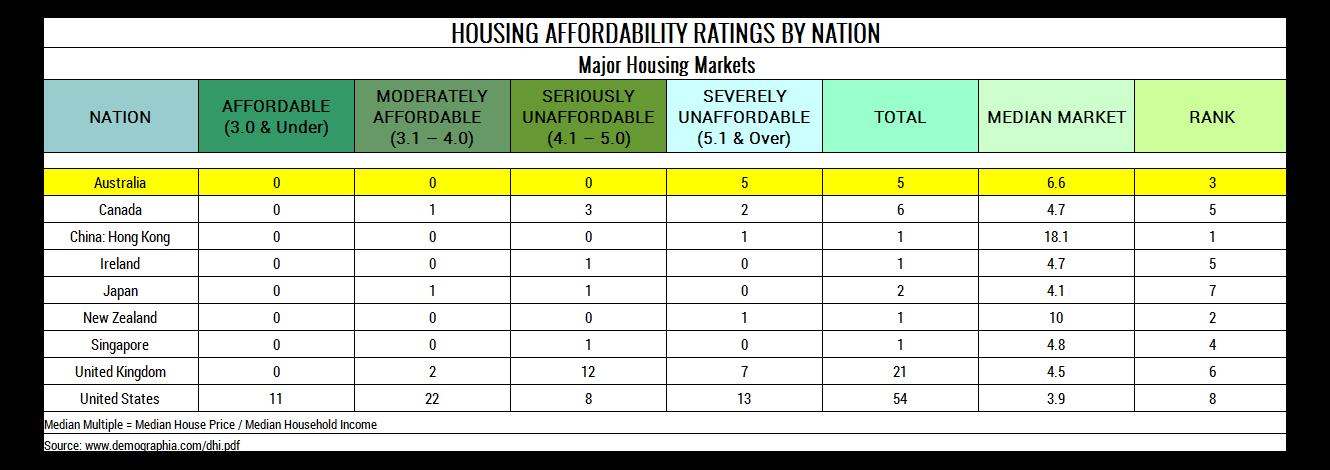
The survey offers an overview of the distribution of the 406 housing markets per country and per Median Multiple. Here’s the rankings based on major housing markets:
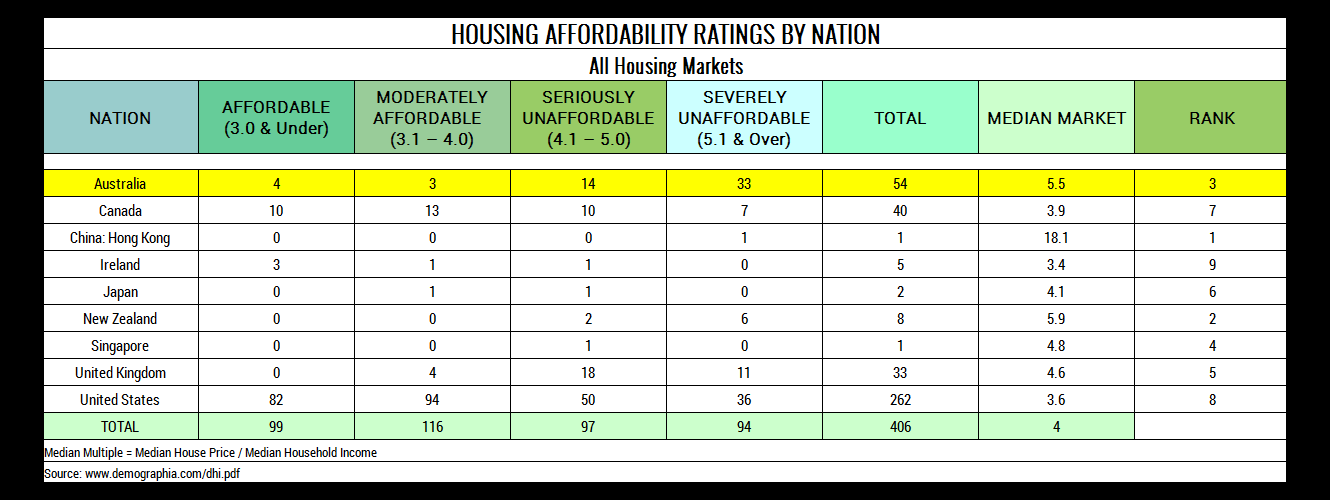
And here’s the rankings based on all housing markets:
TOP 10 MOST AND LEAST AFFORDABLE HOUSING MARKETS
On an international scale, the survey was able to identify the top 10 most affordable and least affordable housing markets. Surprisingly, on the list of the top 10 most affordable housing markets, one city in WA made the cut:
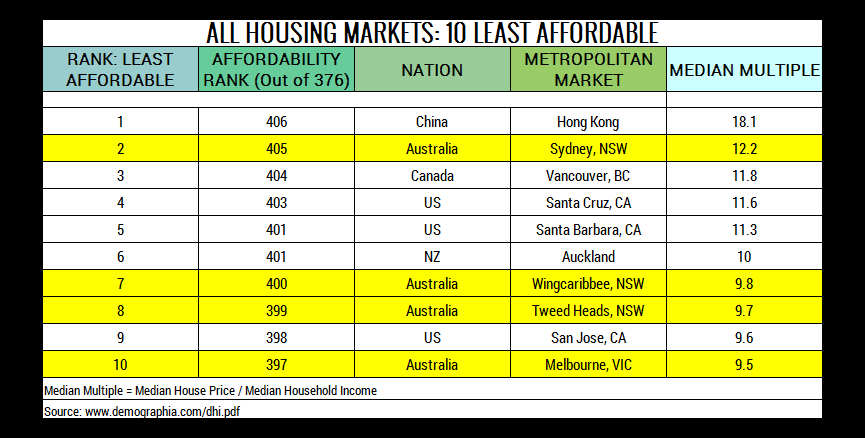
In contrast, here’s the table that shows the top 10 least affordable housing markets. Australia has four cities on the list, including Sydney:
PRIMARY ISSUES ON HOUSING AFFORDABILITY IN AUSTRALIA
Two primary factors were presented in the survey literature explaining how Australia’s affordability levels might have come about.
Urban Containment
Urban containment is the process limiting developing of land outside of a given area. Australians, especially those in the capital cities, know well enough that they can’t do much development in their land or that the supply of land is being regulated. In this case, house prices increase as a result of lack of supply and lack of development potential for available land.
Hugh Pavletich, co-author of the Demographia survey and a former Fellow at the Urban Development Institute of Australia says,
“It’s very odd. A place like Australia has around 24 million people. It is the same size as the United States which has 320 million people yet somehow Australia doesn’t have enough land to build houses on.”
High Density Living
Pavletich continues, “the focus on high density living also inflates house prices. He warned that Australia could be on the same path as Hong Kong where high levels of unaffordability mean families live in 50 square metre shoe boxes and median house prices are 18 times the average income. That’s where they’re taking it because of these failed policies.”
So how’s it looking so far when it comes to the Australian housing markets?
HOUSING AFFORDABILITY RANKINGS: AUSTRALIA
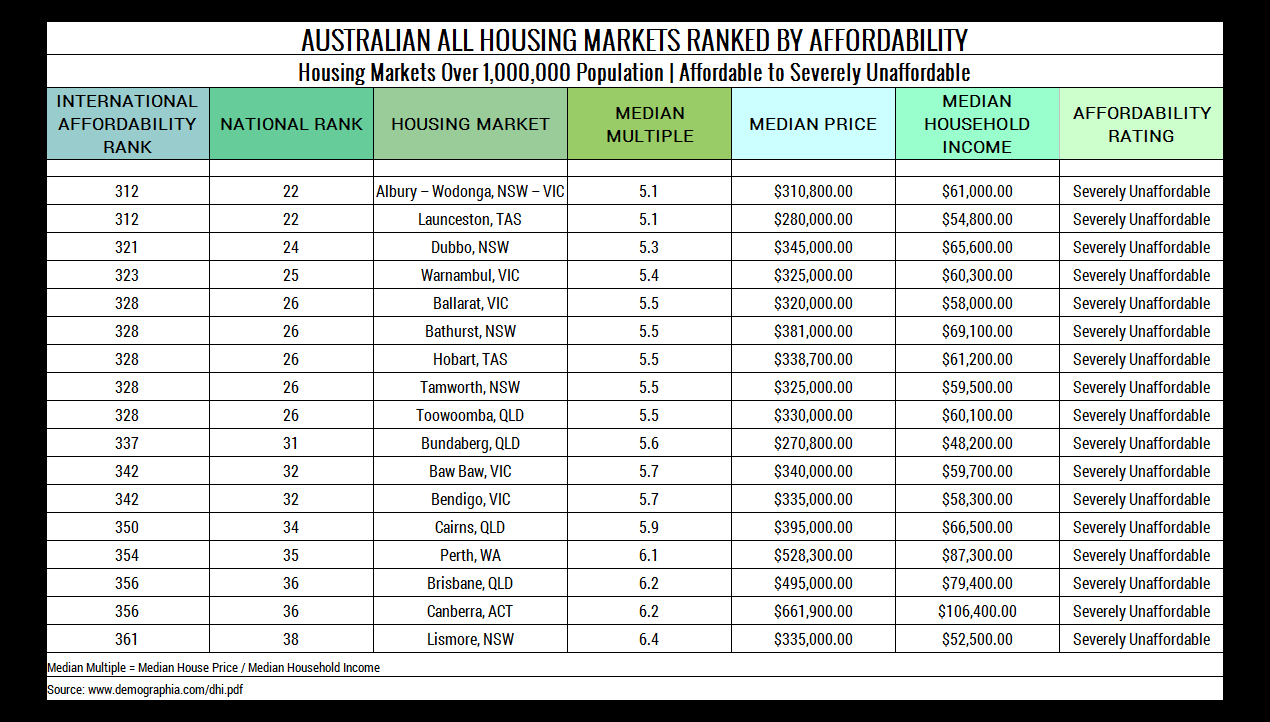
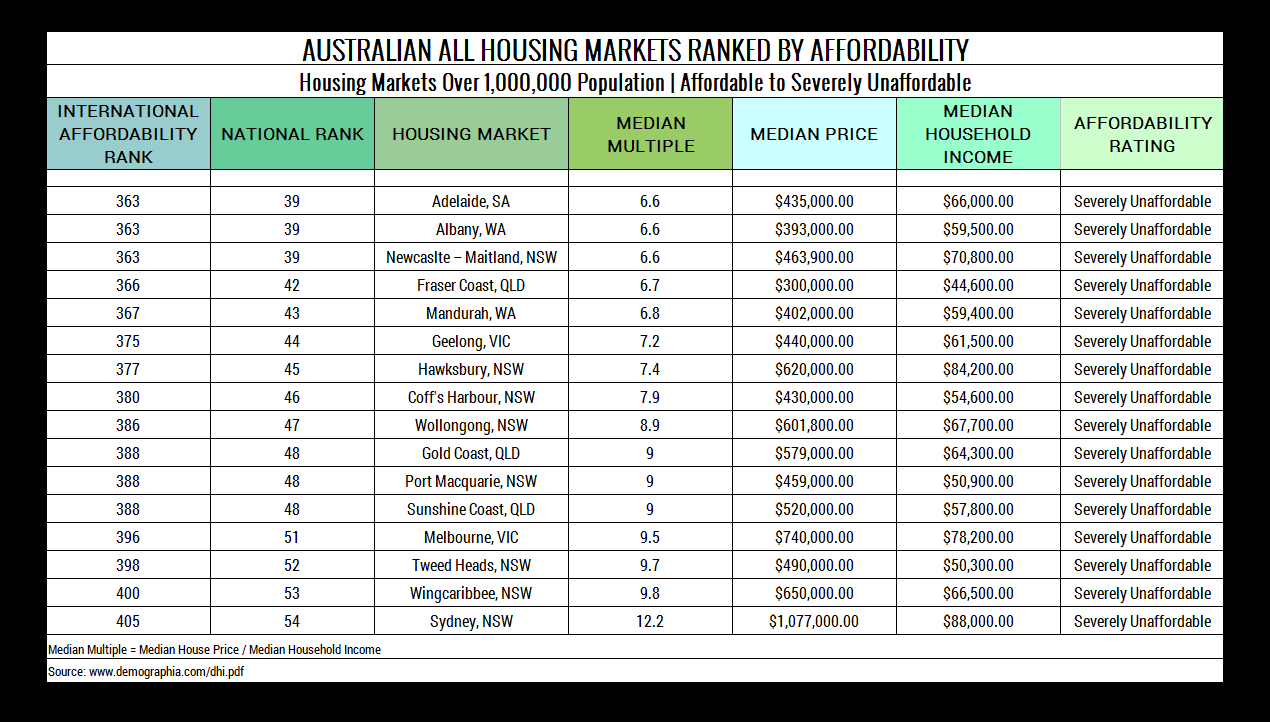
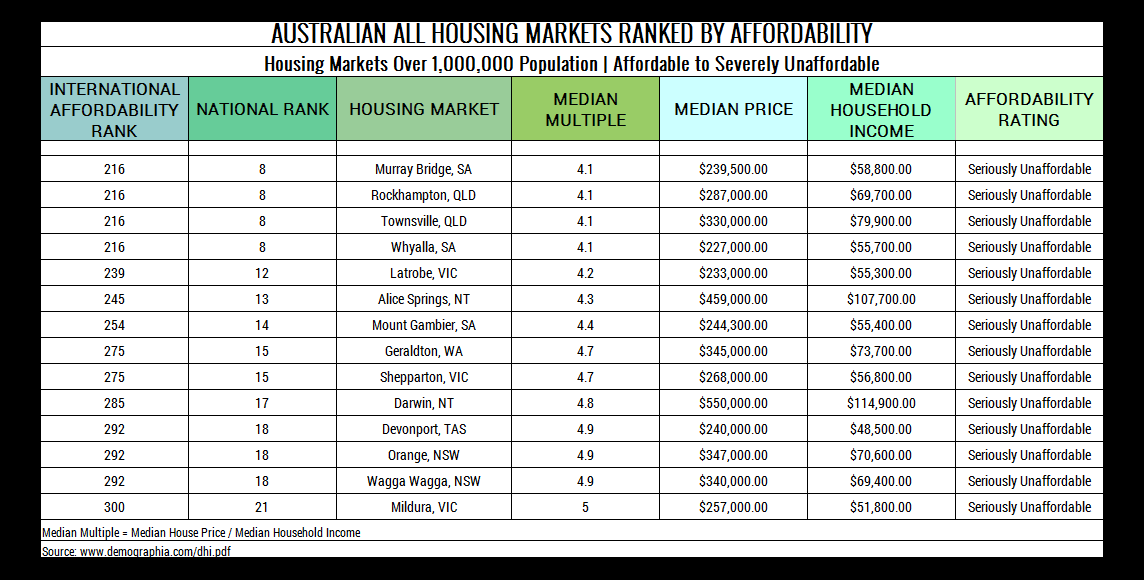
Since 2004, when Demographia started their annual survey, Australia’s major markets (all five of them) have recorded a Median Multiple that indicates severely unaffordable housing. For this survey, the overall Median Multiple for the five major housing markets is 6.6. For all 54 housing markets included for Australia, the overall Median Multiple is still 5.5. Of the 54, 33 are severely unaffordable; 14 are seriously unaffordable, and 4 are affordable. But despite these four housing markets being considered affordable in reference to their Median Multiples, a word of caution was offered in the survey’s discussion.
But first, let’s take a look at how the five major housing markets in the country are ranked in the survey:
And finally, here’s how all 54 housing markets in Australia look like in terms of the affordability rating:
A WORD OF CAUTION
While the preceding data is useful when it comes to getting a comparative view of the country’s housing markets, it should not be used as an absolute guide in making investment decisions. For the purpose of education, the data was presented above. Recent events have a crucial effect on the resulting Median Multiple for each market. An example would be the challenges currently faced by mining towns, as well as the domestic out-migration being observed in the suburbs of Sydney. These events, plus those that are unique to each housing market all point to the characteristic nature of the Australian property market as markets within markets.
